
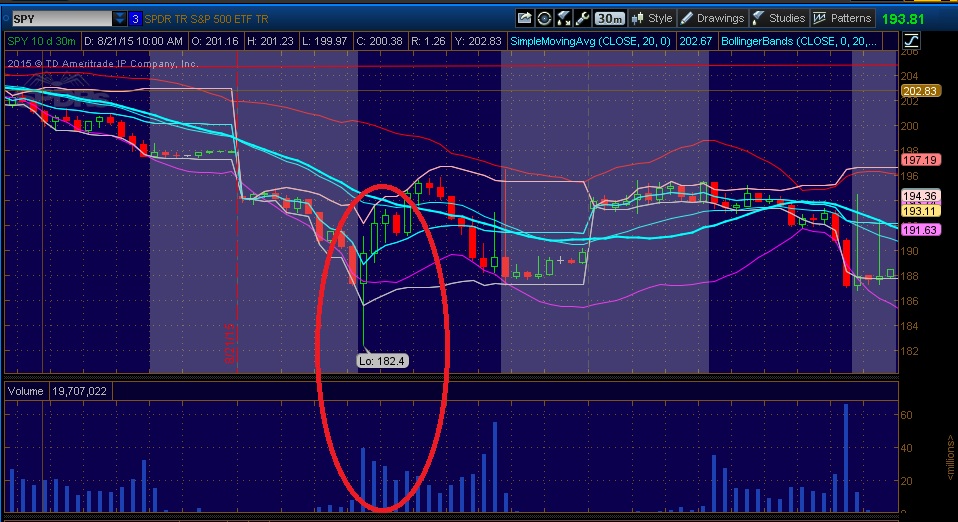
The Standard & Poor’s 500 Index just had its worst month on August 2015, since May 2012. The bears are rejoicing, the bulls are uneasy, and the pigs are left slaughtered.
On Monday, August, 24, 2015, The Dow Industrials plunged at the start of the week, briefly tumbling by more than 1,000 points.
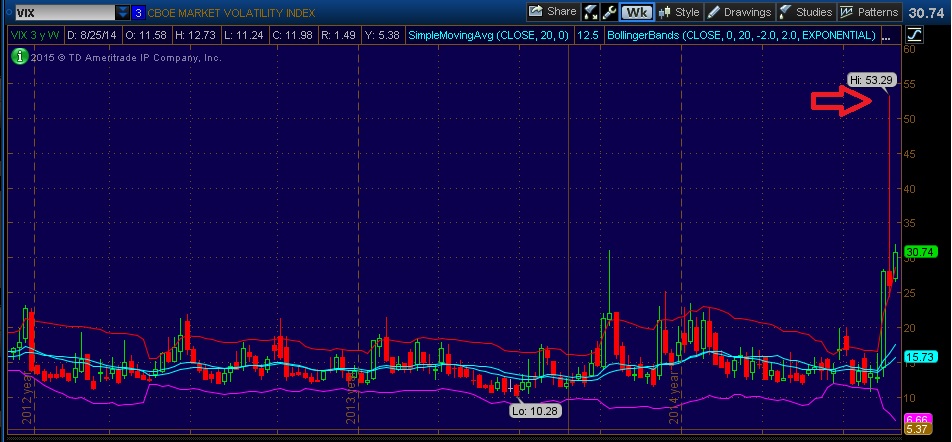
At that time, the VIX (CBOE Volatility Index) a popular measure of the implied volatility of S&P 500 index options, also commonly referred to as the fear index or the fear gauge, reached 53.29. Indeed that morning, (and even still today as of 9.1.15 1pm EST with $SPY -2.5%) fear is pervasive over the markets.
Some highlights of the VIX index are:
- 2004 – On March 26, 2004, the first-ever trading in futures on the VIX Index began on the CBOE Futures Exchange (CFE).
- 2006 –VIX options were launched in February 2006.
- 2008 – On October 24, 2008, the VIX reached an intraday high of 89.53.
- Between 1990 and October 2009, the average value of VIX was 19.04
- On August 24, 2015. the VIX reached an intraday high of 53.29
Amidst a current climate of a strong U.S. dollar, developments in Greece, no definitive guidance regarding FED hikes, and a rapidly declining Chinese stock market, the next catalyst to price discovery becomes the devaluation of the Yuan currency. 
Faced with the reality of recording a decline in Chinese exports in 2015, the Chinese authorities begin a frantic move to boost economic growth. Chinese monetary authorities strategically time their decision to suddenly allow market forces to dictate price movement for the Yuan, resulting in an immediate devaluation of the currency. Adam Smith and his invisible hand would be proud, IF this is truly how the Chinese markets are left to react to price movements in the future.
In a post on ZeroHedge, “Tyler Durden” explains how after the recent devaluation “China has likely sold somewhere on the order of $100 billion in US Treasuries in the past two weeks alone in open FX ops to steady the Yuan.” That might be a drop in the bucket if you consider the fact that China owns $1.27 trillion in U.S treasuries (June, 2015)
The bigger question that looms is, how will the markets react if this rate of orderly liquidation of U.S Treasuries continues to persist over the next 1-2 years?
