Tesla’s Life Saving Offer to acquire Solar City
Last Tuesday, June 21, Tesla Motors (NASDAQ: TSLA) made an offer to acquire Solar City (NASDAQ: SCTY) for $2.8 billion. Any particular bias aside, the acquisition of Solar City could make sense from a strategic point of view:
- It could help Tesla achieve its business objective to provide end-to-end sustainable energy solutions to its customers;
- Tesla could leverage Solar City’s sales force to sell EV’s (electronic vehicle) to customers with solar installations;
- Tesla could leverage Solar City’s tech force to install Tesla’s Powerwall and the battery pack.
The biggest impediment for consumers to buy an EV is the range your car can go before you need to charge it. Most EVs nowadays have enough range to commute in the city. Thinking of going on vacation with your EV? You better think twice. Currently, there is no reliable infrastructure where EV drivers can charge their cars. The result is often called range anxiety. Put simply, range anxiety is freaking out you’ll run out of battery in the middle of nowhere.
Range anxiety is real and Tesla knows it. The company has tried to address it by improving battery life but this approach takes time, costs money and it doesn’t really solve the problem. Even the longest lasting battery is bound to run out of juice at some point.
There is another solution – it’s not cheap but it is more effective. Building a network of charging stations along the major highways, just like gas stations, would do a lot better job at assuaging range anxiety than any promises of batteries with eternal life.
Elon Musk and Tesla know this. They also know that several years ago Solar City had a mutual project with Rabobank to install charging stations along Hwy 101 at Rabobank locations.
Solar City’s project with Rabobank is neat but not revolutionary. But What if Solar City were to build such an infrastructure along all major highways in the US? Such a project requires a long-term bet on EVs and them gaining major popularity nationwide.
Building a charging station infrastructure would make the sale of EVs easier but it will also provide a new revenue stream for Tesla. Just like gas stations, Tesla would charge its users for their consumption, just like gas stations do. Tesla could also benefit from a first-mover advantage by being the only game in town offering battery recharging solutions on the go.
Why Solar City Need This Deal Desperately
In the past three years Solar City has been running financial losses to the tune of $57 million a year.
Solar City’s cash flows from operations dropped with a thud in 2015 to -$790 million and since 2014 the company has been burning through cash.
The dismal financial picture is only the tip of the iceberg. The biggest threat to Solar City’s survival is its own business model. The billionaire hedge fund manager Jim Chanos explains that “the problem with Solar City is they’re losing money on every installation and making it up on volume”.
Solar City’s business model works like this: you lease a solar PV installation from them, they install it on your roof and then you pay them rent. Solar City pays for the installation and they do the maintenance on the system if anything goes wrong.
After the lease is up, the panels are yours or you pay some nominal amount to Solar City to acquire them.
The key to making this model work is to price your panel lease in a way that they:
- pay your capital outlay over some reasonable period of time (e.g. 10 years),
- cover your annual maintenance cost,
- pay for your general overhead, and
- give you some reasonable rate of return.
In theory, this sounds like a sound model but if you scratch the surface you discover holes that would make any investor cringe.
For starters, the solar panel lease rates are market driven. Worsening economy would put pressure on Solar City to lower its lease rates in order to appeal to home owners.
Most people install solar panels on their roofs for two main reasons: because it could save them some money and because it is cool.
If the motivation of Solar City’s customers is primarily to save money by paying less in electricity prices, the incentive is not big. The only way for Solar City to increase it is to drop its lease rates, which would mean incurring even bigger losses.
If the cool factor is the primary driver, then Solar City is really riding a trend – even if it is a long-lasting one.
Even if all of the latter risks are endemic to the solar industry at large, this next one is related specifically to Solar City’s business model.
Solar City leases solar panels to home owners and makes its money by charging a lease. Since Solar City puts up the capital investment upfront to install the solar panels, it needs its customers to stay solvent and pay their lease for at least 5 to 10 years. This is how long it would take for the company to recover its original capital investment. If Solar City is forced to drop its lease rates to stay competitive, it might take longer.
If a Solar City customer defaults on the lease, the company is out of luck. It could take the panels down and re-install them somewhere else but the cost of doing this could be prohibitive.
When it comes to Solar City the risk is even higher. Most of its installations are along the coasts. You need only a regional housing crisis to wipe out most of Solar City’s active leases.
If the existing Solar City model looks like a total mess, Elon Musk offers a neat way out. By getting Tesla to buy the company, Solar City’s shareholders will get ownership in a bigger and more diversified company. Tesla would also give Solar City an opportunity to adopt a more sustainable business model and acces to larger capital markets than their current business model.
The only question that remains is, when I can drive my solar city powered Tesla across the country?
_________________________________________________________________
Victor Kalchev is a financial analyst employed within in the renewable energy industry for the past several years. He holds a Master’s in Business Administration and has been involved in market valuations of renewable energy projects.
Do circuit breakers provide a false sense of security?
Approved in 1987, in response to Black Monday, regulators first introduced circuit breakers into U.S markets to curb significant volatility. They developed these rules to allow exchanges to halt trading temporarily in instances of exceptionally large price declines. On October 19, 1987, the S&P 500 dropped more than 20% in a single day. Let’s look at the days preceding and following this event.
Notice how the Friday proceeding Black Monday recorded a 5.6% decline, followed by the crash, digestion and recovery. That is the last time we will ever see daily volatility of that magnitude in the U.S markets. For example, under current rules, the New York Stock Exchange will temporarily halt trading when the S&P 500 stock index declines 7 percent, 13 percent, and 20 percent in order to provide investors “the ability to make informed choices during periods of high market volatility.”
I can understand how these rules are intended to restore investor confidence during a period of erratic volatility, but let’s remember the context of this mechanism. Is it supposed to invoke a feeling of re-assurance or panic?
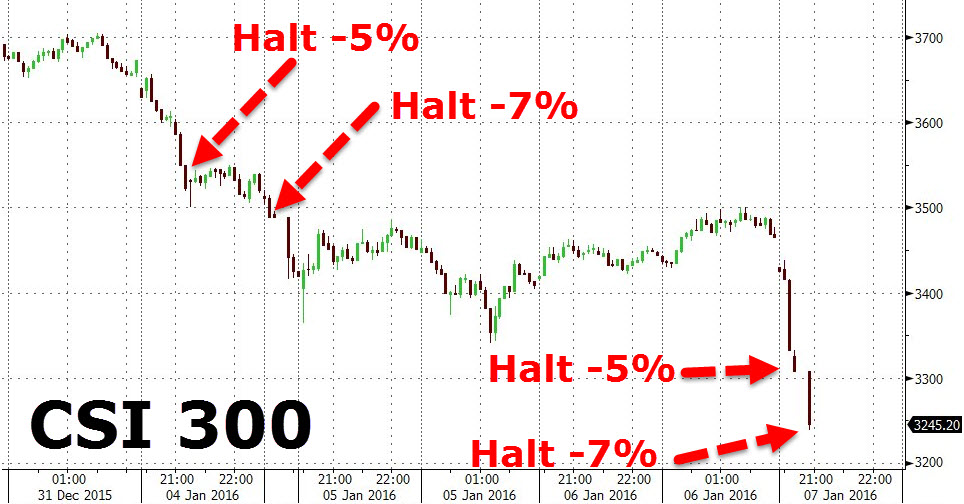
On January 4, 2016, China implemented their own circuit breakers into their financial markets, which halt exchanges for 15 minutes after a 5 percent drop in the Shanghai Shenzhen CSI 300 Index and for the rest of the day after a 7 percent decline.
In the first week of trading in 2016, these circuit breakers halted trading twice for each respective day.
We don’t know why Chinese regulators felt that a 7% swing would be a manageable as an upper limit, but we do know that they have since decided to abolish these circuit breakers as an effective tool to curb volatility, at least for the time being.
The brief presence of these circuit breakers exacerbated losses as Chinese investors scrambled to exit positions before getting locked in. Despite the removal of these breakers from the markets, we must wonder how this impacts the rationale of the average investor to equity markets in China.
Growth in the industrial economy in the world’s second largest economy slowed drastically in 2015, and the Peoples Bank of China (PBOC) has resorted to its usual response of enhanced government spending in an effort to offset this slump.
We have to imagine what internal thresholds of pain as they relate to financial reserves need to be breached before market forces are truly allowed to prevail.
Welcome Back Volatility!
The Standard & Poor’s 500 Index just had its worst month on August 2015, since May 2012. The bears are rejoicing, the bulls are uneasy, and the pigs are left slaughtered.
On Monday, August, 24, 2015, The Dow Industrials plunged at the start of the week, briefly tumbling by more than 1,000 points.

At that time, the VIX (CBOE Volatility Index) a popular measure of the implied volatility of S&P 500 index options, also commonly referred to as the fear index or the fear gauge, reached 53.29. Indeed that morning, (and even still today as of 9.1.15 1pm EST with $SPY -2.5%) fear is pervasive over the markets.

Some highlights of the VIX index are:
- 2004 – On March 26, 2004, the first-ever trading in futures on the VIX Index began on the CBOE Futures Exchange (CFE).
- 2006 –VIX options were launched in February 2006.
- 2008 – On October 24, 2008, the VIX reached an intraday high of 89.53.
- Between 1990 and October 2009, the average value of VIX was 19.04
- On August 24, 2015. the VIX reached an intraday high of 53.29
Amidst a current climate of a strong U.S. dollar, developments in Greece, no definitive guidance regarding FED hikes, and a rapidly declining Chinese stock market, the next catalyst to price discovery becomes the devaluation of the Yuan currency.
Faced with the reality of recording a decline in Chinese exports in 2015, the Chinese authorities begin a frantic move to boost economic growth. Chinese monetary authorities strategically time their decision to suddenly allow market forces to dictate price movement for the Yuan, resulting in an immediate devaluation of the currency. Adam Smith and his invisible hand would be proud, IF this is truly how the Chinese markets are left to react to price movements in the future.
In a post on ZeroHedge, “Tyler Durden” explains how after the recent devaluation “China has likely sold somewhere on the order of $100 billion in US Treasuries in the past two weeks alone in open FX ops to steady the Yuan.” That might be a drop in the bucket if you consider the fact that China owns $1.27 trillion in U.S treasuries (June, 2015)
The bigger question that looms is, how will the markets react if this rate of orderly liquidation of U.S Treasuries continues to persist over the next 1-2 years?
How much would you bet to play this game?
“Those who cannot remember the past are condemned to repeat it.” – George Santayana
Imagine the following game: A coin is flipped. If it comes up tails, you don’t win anything thus ending the game. If it comes up heads however, you win $1 and you get to flip again. If on this second toss it comes up heads again, you double your last payout and you are now awarded $2, and you get to flip again. If on the third toss, it comes up heads again, your payout becomes $4, and you get to flip again. The probability of each possible outcome decreases as a function of outcome size. The probability of large outcomes is very low, but not zero. The question then becomes, how much would you be willing to pay in order to participate this game?
This scenario known today as the St. Petersburg paradox was first introduced in September 1713 by Nicolas Bernoulli. It was then debated for close to thirty years until when his cousin, Daniel Bernoulli, presented his opinion on risk aversion, risk premium and utility in the paper “Exposition of a New Theory on the Measurement of Risk.” The following provides graphical illustrations of the outcomes as well as the probabilities of potential payouts:

The answer to this paradox gave way to the introduction of the concepts of utility function, an expected utility hypothesis, and the diminishing marginal utility of money.
In Daniel Bernoulli’s own words:
- “The determination of the value of an item must not be based on the price, but rather on the utility it yields…. There is no doubt that a gain of one thousand ducats is more significant to the pauper than to a rich man though both gain the same amount.” “The man who is emotionally less affected by a gain will support a loss with greater patience. “
Despite this dissonance, the expected utility theory remained our best understanding of how to choose rationally when we are unsure which outcome will result from our actions. However, in 1979, Daniel Kahneman and Amos Tversky published “Prospect Theory: An Analysis of Decision under Risk”; an important paper that used cognitive psychology to explain various divergences of economic decision-making from expected utility theory.
In it, they offer this theory: people don’t always maximize utility, rather people value gains and losses differently, and, as such, will base decisions on perceived gains rather than perceived losses. Thus, if a person were given two equal choices, one expressed in terms of possible gains and the other in possible losses, people would choose the former – even when they achieve the same economic end result.
For example, in a traditional way of thinking, the amount of utility gained from making a trade with a profit of $500 should be equal to a situation in which you make two trades; one with a profit $1000 and then another one with a loss of $500. In both situations, the end result is a net gain of $500.
However, despite the fact that you still end up with a $500 gain in either case, most people view a single gain of $500 more favorably than gaining $1000 and then losing $500. Further, most loss aversion studies suggest that losses are twice as powerful, psychologically, as gains.
“We have an irrational tendency to be less willing to gamble with profits than with losses.” – Kahneman & Tversky (1981)

The Time Magazine Cover Indicator
“All economic movements, by their very nature, are motivated by crowd psychology.” — Financier Bernard Baruch
Originated by the late Paul Macrae Montgomery; The Time Magazine Cover Indicator serves as a contrarian signal, which essentially tells us whether some investment theme has reached a crescendo. The rationale follows that by the time a company’s success or failure reaches the cover page of a major publication, the company is so well known that it is reflected fully in the current stock price.
The findings of three University of Richmond professors published in their study “Are Cover Stories Effective Contrarian Indicators” prove as much. Their research examined Business Week, Fortune, and Forbes, and found a correlation between the cover of the publication and the performance of a stock.Their findings indicate that positive stories generally indicate that the stock’s price performance has topped out. Negative stories often come right at the time of a turnaround.
The study confirms that it is better to bet against journalists than alongside them.
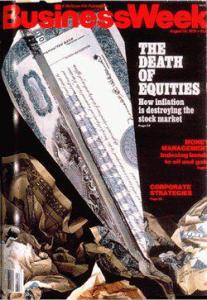
Business Week’s August 13, 1979 “The Death of Equities” cover claimed investors – burned by years of bad returns in the 1970s – turned their back on stocks for good. That was just before the market launched into an 18-year rally.
Times’ “Home Sweet Home” cover story in June 2005 called the very top of the housing market. Newsweek’s April 2010 cover declared “America’s Back!” right before the Dow plunged from 11,200 to about 9,500.
However, rather than blame all of our investment woes on journalists, it would be more constructive for us to recognize what Montgomery realized long ago. “Standard economic theories overlooked the human factor in markets.”
“When we speak of thing’s having value, we are referring to the human desire for that particular thing at that particular time. Value is thus a quality appertaining not to external materiality, but rather to internal, immaterial mental states.”
Tops and bottoms in any market are a creation of extreme market psychology. “The basic principles of human neurophysiology are so similar, that if we become uncomfortable enough to significantly change our market position, it is virtually certain that a number of other people are doing precisely the same thing at precisely the same time, thereby creating a temporary turning point in bond prices and interest rates.”
Follow @thms2Market Structure and its relevance to Volatility
In-depth conversation about value and volatility in the markets must first begin by addressing the world we live in today. Whether you sit on the fence, or are passionately for/against the need for High Frequency Trading (“HFT”) in our markets, is beside the point. They exist today and we have/will just have to learn to co-exist, perhaps even adapt.
A chronicle of the history of the modern stock market can be best explained with books like Scott Patterson’s Dark Pools, while Michael Lewis’ Flash Boys, sheds even more light on prevailing practices within our exchanges post 2007. Do yourself a favor and add these books to your amazon wish list. Utilize these resources to learn as much as you can to learn about how we got to this present age of HFT.
How did it start, what allowed their existence?
Reg NMS is a U.S. financial regulation promulgated and described by the United States Securities and Exchange Commission (S.E.C.) as “a series of initiatives designed to modernize and strengthen the National Market System for equity securities.” The Reg NMS is intended to assure that investors receive the best price executions for their orders by encouraging competition in the marketplace. It was established in 2007. Its aim was to foster both “competition among individual markets and competition among individual orders” in an effort to promote efficient and fair price formation across securities markets.
Intent vs. reality:
If we read the above the intent of the S.E.C., are alarm bells going off in our heads? I mean what could be malicious about the preceding statements? However, the world we live in is capitalistic and purely profit driven. Despite the S.E.C.’s intent with those regulations, eventually market participants involved in HFT practices evolved their strategy to utilize:
- Use of extraordinarily high speed and sophisticated programs for generating, routing, and executing orders.
- Use of co-location services and individual data feeds offered by exchanges and others to minimize network and other latencies.
- Very short time-frames for establishing and liquidating positions.
- Submission of numerous orders that are cancelled shortly after submission.
- Ending the trading day in as close to a flat position as possible (that is, not carrying significant, unhedged positions overnight).
It may surprise you to find out that “trading ahead of the market” or “front running” is entirely legal.
The S.E.C.’s perspective (2014):
What we can ascertain today:
In an article on Vanity Fair, Michael Lewis explains his views a year after his book, Flash Boys went on sale. “And since late 2007, as a study published in early 2014 by the investment-research broker ITG has neatly shown, the cost to investors of trading in the U.S. stock market has, if anything, risen—possibly by a lot.”
We can ascertain that increased volatility is not only prevalent but widespread in our markets today. Whether the increase in this volatility actually serves a purpose is difficult to decipher. All we know is that aggressive HFT’s are the ones that actually make money at the end of the day and their profits (perhaps even guaranteed profits) are influenced by their aggressive trading behavior. This fact alone should make us all buckle our safety belts and be prepared for a bumpy ride.
As one Goldman Sachs executive, Brian Levine, put it, “Unless there are some changes, there’s going to be a massive crash”, he said, “a flash crash times ten”…”I think it’s a business decision. I also think it’s a moral decision.” (p. 238 – Flash Boys)
Bitcoin – the evolution of a digital currency
What is Bitcoin?
How does Bitcoin work?
Since bitcoin is like electronic cash, most purchases take place online. It’s also possible to send and receive bitcoin in person at retail shops, or anywhere else where bitcoin is accepted.
Behind the scenes, the Bitcoin network is sharing a public ledger called the “block chain”. The blockchain, which tracks who owns what, similar to how a bank tracks assets. The authenticity of each transaction is protected by digital signatures corresponding to the sending addresses, allowing all users to have full control over sending bitcoins from their own Bitcoin addresses. In addition, anyone can process transactions using the computing power of specialized hardware and earn a reward in bitcoins for this service. This is often called “mining“.
How does one acquire bitcoins?
- As payment for goods or services.
- Purchase bitcoins at a Bitcoin exchange.
- Exchange bitcoins with someone near you.
- Earn bitcoins through competitive mining
Validity Concerns?
While a growing cadre of retailers are beginning to accept Bitcoin, recent events have underscored concerns about the viability of the currency. The governments of India, China and Russia have sought to ban or limit its use, and the Mt. Gox exchange filed for bankruptcy protection in February, 2014.
A lot of people believe that Bitcoin’s full potential hasn’t been realized yet. Aside from making relatively fast peer-to-peer transactions, there’s no good case for using Bitcoin over traditional currency for most consumers. Plus, there still isn’t a wide array of merchants that accept it. What’s more, Price volatility is another major barrier to getting consumers on board.
That might not change anytime soon. At the moment Bitcoin is mostly in the hands of speculators and investors, and they’re playing the market like traders, which drives more volatility. The following illustrates the volatility and Bitcoin prices since its inception.
There are clearly still a lot of concerns with the validity of Bitcoin and potential mainstream adoption of the currency, however, this Author is long Bitcoin and sees the disruptive way that it could potentially change our day to day lives. At the very least, my opinion on the asset, is congruent with some respectable, credible early adopters.
To be clear, nothing here is a recommendation to buy or sell the security, its just my opinion on it.
Oil Squeeze – Factors related to the decline in Oil in 2014
Oil futures are currently trading at $54.04 (12/29/14 – 11:16 am CST) and it’s hard to even gauge where the bottom might be. Back in June, 2014 Oil was trading at $107 and has over the past 6 months taken quite the beating of approximately 50%. Some of the global implicit factors suppressing the market price of oil are:
(1) Demand is low because of weak economic activity, increased efficiency, and a growing dependence away from oil to other fuels.
(2) Turmoil in Iraq and Libya has not affected their output.
(3) America has become the world’s largest oil producer. Though it does not export crude oil, it now imports much less, creating a lot of spare supply.
(4) The Saudis and their Gulf allies have decided not to sacrifice their own market share to restore the price. Saudi Arabia can tolerate lower oil prices quite easily. It has $900 billion in reserves.
Clearly market forces that affect supply and demand are all that matters. Industry experts are left befuddled as they exclaim “We’re at the stupid range,” Stephen Schork, editor and founder of The Schork Report, said in an interview with CNBC. “We don’t know how much lower oil can go,” Schork said. “It’s similar to 2008 when we knew oil at $120, $130 and $140 made no sense, but high prices became the reason for higher prices. It’s the same thing in reverse.”
Is $40-45 a barrel a realistic scenario? Time will tell but as for now, if we’re not driving around a Tesla or a Prius we are still happy to see this:
TESLA – Volatility & Manipulation
Tesla ($TSLA) has been a phenomenal company to follow, largely because of the creativity, conviction, intellect and drive of their employees and CEO Elon Musk. Business students years from now will have case studies on how Mr. Musk almost went broke, but managed to turn both his companies; SpaceX and Tesla around to formidable powerhouses in modern society. He amongst Jeff Bezos and Jack Ma are who we will consider elite CEO’s of our generation.
Regardless of management talent, I want to highlight how TSLA has traded and manipulated from 10/27/14 – 10/29/14. So the story goes like this, on October 27, 2014 at 11:03 a.m. the wire gets a hold of a story by the Wall Street Journal, which cites WardsAuto.com as a source saying that Tesla Sales Down 26% through September vs prior year. The obvious happens in light of this information and this stock just caters about 9% to close below $222. That might be only $10 swing you say, however that swing represents approximately $1.5 billion in market cap. (as of 10/31/14)
About 9-10 hours after close of trading, a little past midnight on 10/28/2014 Elon Musk tweets this:
The next morning, $TSLA has a huge day and closes up above $242.5. It’s like nothing happened, well almost. Here’s a theory, that article was fabricated and leaked out to the masses intentionally so that some individuals could get that price around $220 or make everyone else fill their stops. Obviously this could all just be a mere coincidence and a tale of a financial journal rushing to get the news out first regardless of credibility. Time will tell as the Company has an earnings release coming up.
Obviously, nothing here is a recommendation to buy or sell the security, it just an example of how volatile equities can become in our world of real-time information, regardless of whether the information is accurate or not.